Code
library(tidytuesdayR)
tuesdata <- tidytuesdayR::tt_load('2022-11-29')
Downloading file 1 of 2: `wcmatches.csv`
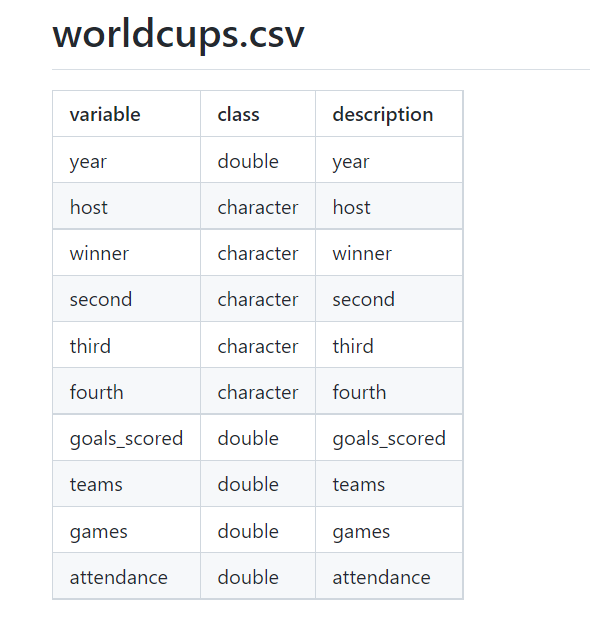
Downloading file 2 of 2: `worldcups.csv`
library(tidytuesdayR)
tuesdata <- tidytuesdayR::tt_load('2022-11-29')
Downloading file 1 of 2: `wcmatches.csv`
Downloading file 2 of 2: `worldcups.csv`wcmatches <- tuesdata$wcmatches
worldcups <- tuesdata$worldcups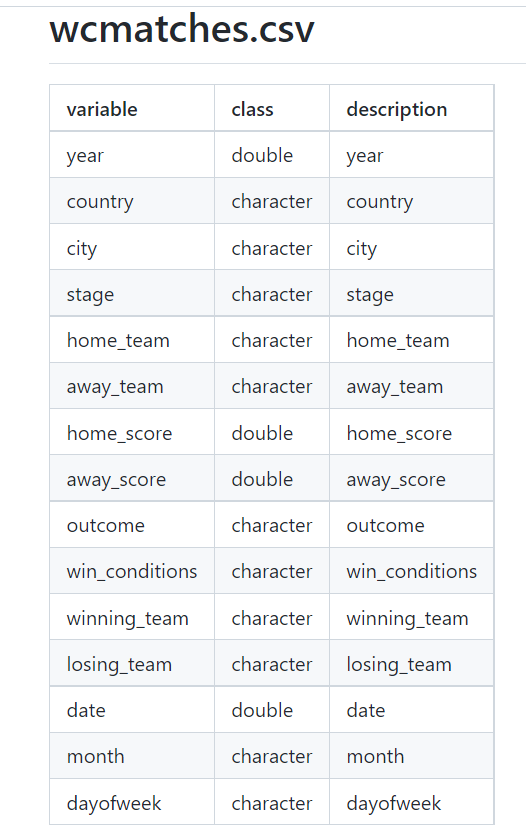
library(tidyverse)
glimpse(wcmatches)
Rows: 900
Columns: 15
$ year <dbl> 1930, 1930, 1930, 1930, 1930, 1930, 1930, 1930, 1930, 1…
$ country <chr> "Uruguay", "Uruguay", "Uruguay", "Uruguay", "Uruguay", …
$ city <chr> "Montevideo", "Montevideo", "Montevideo", "Montevideo",…
$ stage <chr> "Group 1", "Group 4", "Group 2", "Group 3", "Group 1", …
$ home_team <chr> "France", "Belgium", "Brazil", "Peru", "Argentina", "Ch…
$ away_team <chr> "Mexico", "United States", "Yugoslavia", "Romania", "Fr…
$ home_score <dbl> 4, 0, 1, 1, 1, 3, 0, 0, 1, 6, 1, 0, 0, 4, 3, 6, 6, 4, 2…
$ away_score <dbl> 1, 3, 2, 3, 0, 0, 4, 3, 0, 3, 0, 1, 4, 0, 1, 1, 1, 2, 3…
$ outcome <chr> "H", "A", "A", "A", "H", "H", "A", "A", "H", "H", "H", …
$ win_conditions <chr> NA, NA, NA, NA, NA, NA, NA, NA, NA, NA, NA, NA, NA, NA,…
$ winning_team <chr> "France", "United States", "Yugoslavia", "Romania", "Ar…
$ losing_team <chr> "Mexico", "Belgium", "Brazil", "Peru", "France", "Mexic…
$ date <date> 1930-07-13, 1930-07-13, 1930-07-14, 1930-07-14, 1930-0…
$ month <chr> "Jul", "Jul", "Jul", "Jul", "Jul", "Jul", "Jul", "Jul",…
$ dayofweek <chr> "Sunday", "Sunday", "Monday", "Monday", "Tuesday", "Wed…glimpse(worldcups)Rows: 21
Columns: 10
$ year <dbl> 1930, 1934, 1938, 1950, 1954, 1958, 1962, 1966, 1970, 197…
$ host <chr> "Uruguay", "Italy", "France", "Brazil", "Switzerland", "S…
$ winner <chr> "Uruguay", "Italy", "Italy", "Uruguay", "West Germany", "…
$ second <chr> "Argentina", "Czechoslovakia", "Hungary", "Brazil", "Hung…
$ third <chr> "USA", "Germany", "Brazil", "Sweden", "Austria", "France"…
$ fourth <chr> "Yugoslavia", "Austria", "Sweden", "Spain", "Uruguay", "W…
$ goals_scored <dbl> 70, 70, 84, 88, 140, 126, 89, 89, 95, 97, 102, 146, 132, …
$ teams <dbl> 13, 16, 15, 13, 16, 16, 16, 16, 16, 16, 16, 24, 24, 24, 2…
$ games <dbl> 18, 17, 18, 22, 26, 35, 32, 32, 32, 38, 38, 52, 52, 52, 5…
$ attendance <dbl> 434000, 395000, 483000, 1337000, 943000, 868000, 776000, …replay West Germany to Germany across all column with str_replace function.
worldcups=worldcups %>% mutate_all(list(~str_replace(., "West Germany", "Germany")))worldcups_data001=worldcups %>% group_by(winner) %>% count() %>% arrange(desc(n)) %>% head(5) %>% rename(country=winner) %>% mutate(rank='1:winner')
worldcups_data002=worldcups %>% group_by(second) %>% count() %>% arrange(desc(n)) %>% head(5) %>% rename(country=second) %>% mutate(rank='2:second')
worldcups_data003=worldcups %>% group_by(third) %>% count() %>% arrange(desc(n)) %>% head(5) %>% rename(country=third) %>% mutate(rank='3:third')
worldcups_data004=rbind(worldcups_data001,worldcups_data002,worldcups_data003)
worldcups_data004# A tibble: 15 × 3
# Groups: country [9]
country n rank
<chr> <int> <chr>
1 Brazil 5 1:winner
2 Germany 4 1:winner
3 Italy 4 1:winner
4 Argentina 2 1:winner
5 France 2 1:winner
6 Germany 4 2:second
7 Argentina 3 2:second
8 Netherlands 3 2:second
9 Brazil 2 2:second
10 Czechoslovakia 2 2:second
11 Germany 4 3:third
12 Brazil 2 3:third
13 France 2 3:third
14 Poland 2 3:third
15 Sweden 2 3:third ggplot(worldcups_data004, aes(x=country, y=n)) +
geom_bar(stat = "identity")+coord_flip()+facet_wrap(~rank)
https://github.com/rfordatascience/tidytuesday/tree/master/data/2022/2022-11-29
https://sparkbyexamples.com/r-programming/replace-using-dplyr-package-in-r/
https://www.datacamp.com/tutorial/facets-ggplot-r